
Probability distributions, such as the Poisson distribution, are statistical functions that describe the possible values and likelihoods of a random variable within a given range. They are used to measure and predict probabilities and to estimate the likelihood of achieving certain outcomes. Probability distributions help obtain estimates of the probability that a certain event may occur or estimate the variability of occurrence.
Named after the French mathematician Siméon Denis Poisson, the Poisson distribution is a fundamental concept in probability theory and statistics. A Poisson distribution may be used to model the number of events occurring within a fixed interval of time or space, especially in scenarios where events happen independently of each other and at a constant average rate over time, such as the number of emails received per day or the number of phone calls received in an hour.
The Poisson distribution is related to other statistical concepts, including the binomial distribution and the exponential distribution. The application of Poisson distribution can help solve complex problems and derive insights into the underlying processes governing random events, making it an important aspect for researchers to understand and use.
What is a Poisson distribution?
A probability distribution depicts all the possible outcomes of a random variable, along with its corresponding probability values. In other words, it links every outcome of a random variable with its probability of occurrence.
Poisson distribution definition: A Poisson distribution is a type of discrete probability distribution that yields the probability of a countable outcome. The number of times an event occurs is the discrete or countable outcome.
A Poisson distribution is characterized by a single parameter, the expected number of events, lambda (λ), which can range from 0 to ∞.
The assumptions for this distribution are as follows:
- The mean rate at which the event occurs (λ) is constant.
- The occurrence of one event does not affect the occurrence of a subsequent event (i.e., the events are independent).
Further, under a Poisson distribution:
- The number of trials “n” tends to infinity
- The probability of success “p” tends to zero
- np = 1 is finite
Examples of Poisson distribution
One of the key properties of the Poisson distribution is its versatility in describing a wide range of real-world phenomena. Whether analyzing traffic flow or number of calls received at a call center, the application of Poisson distribution provides a powerful framework for understanding random processes. Its simplicity and applicability make it a cornerstone of statistical modeling, enabling researchers and practitioners to make informed predictions in diverse fields like finance, healthcare, and engineering.
Let’s look at some specific examples of Poisson distribution:
- The number of people walking into a salon without an appointment in the mornings
- The number of births occurring at a hospital from 8 pm to midnight
- The number of rabbits in a hectare of wilderness
- The number of bacterial colonies in a square inch of a culture plate
![]()
Poisson distribution formula
The Poisson distribution formula (more specifically, the probability mass function of the Poisson distribution) is as follows:
P(x) = (e– λ λx)/x!
where
e is the base of the logarithm (Euler’s constant, ~2.718)
x is a Poisson random variable
λ is an average rate of value
! is the factorial function
Here is a fictional example to explain the Poisson distribution formula:
In a futuristic city, autonomous delivery drones are used to transport packages between various locations. The city is divided into sectors, each with its own network of drones managed by a central control system. The engineers responsible for maintaining the drone fleet are interested in analyzing the frequency of drone malfunctions per month in each sector. The average number of drone malfunctions per month in each sector follows a Poisson distribution. They decide to model this distribution to better understand the occurrence of malfunctions and plan preventive maintenance accordingly. For example, they find that in Sector 3, the average number of drone malfunctions per month is 5. Using the Poisson distribution, they can calculate the probability of one malfunction in a month in this sector as (2.718– 5 × 51)/1!
where
x = 1 malfunction occurring in a month
λ = average of 5 malfunctions a month
e = 2.718
Using the Poisson distribution formula, the probability of a single drone malfunction occurring in Sector 3 is P(x = 1) = 0.03369. Using the Poisson distribution, the engineers can calculate the probability of different numbers of malfunctions occurring in a given month for each sector. This information allows them to anticipate potential issues, schedule maintenance activities proactively, and ensure that the drone network operates smoothly.

Probability mass function graphs
A probability density function is associated with continuous rather than discrete random variables. A probability mass function is different from this as it describes the probability of each possible value of a discrete random variable. That is, a probability mass function describes a discrete probability distribution. A Poisson distribution is a type of discrete probability distribution and can be visually depicted as a graph of the probability mass function.
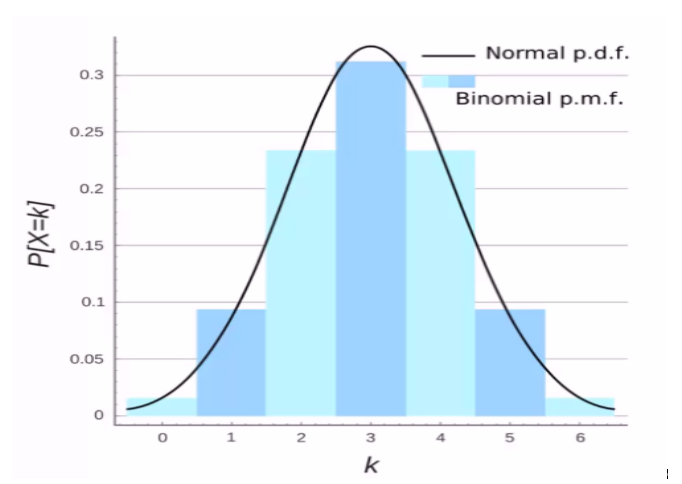
Fig. 1: Difference between probability density function and probability mass function.[1]
The peak of this distribution is called the mode, the most probable number of events. When λ is low, the distribution is right-skewed, that is, it is more stretched towards the right side of its peak than its left. As λ increases, the distribution resembles normal distribution.
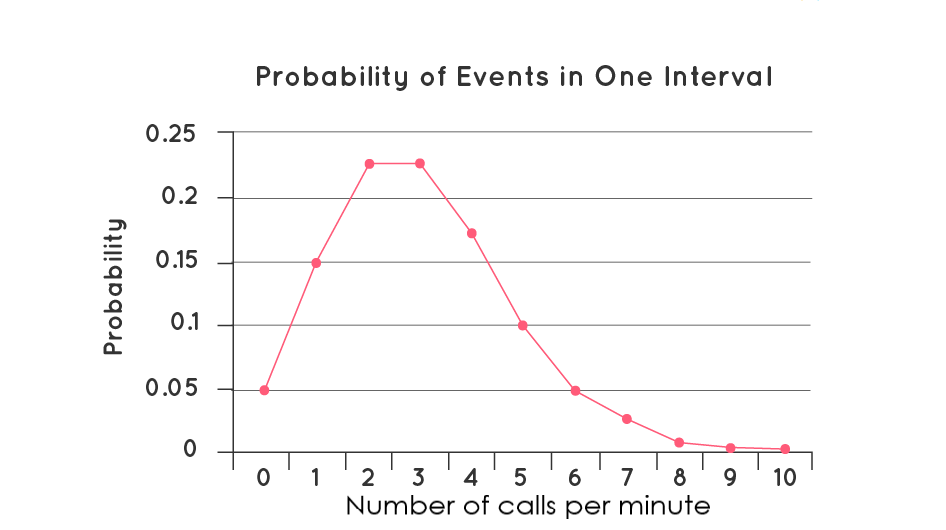
Fig. 2: Probability mass function for Poisson distribution.[2]
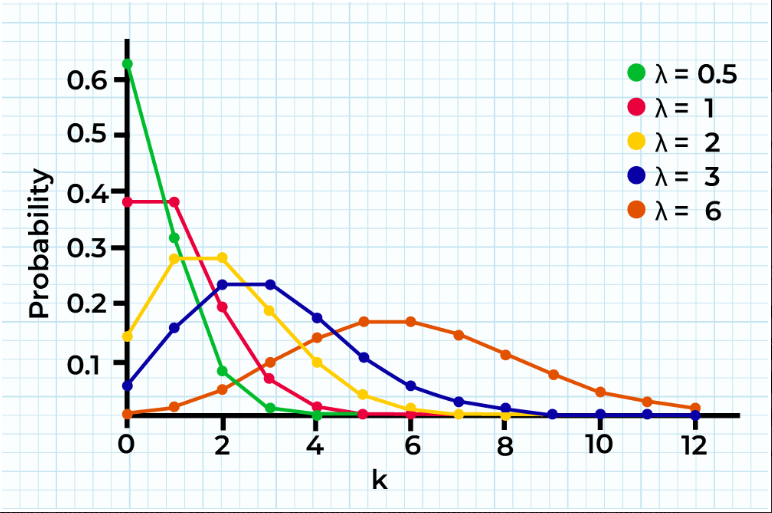
Fig. 3: Graph of Poisson distribution or Poisson distribution curve.[3]
Poisson distribution table
A Poisson distribution table tabulates the probabilities for a Poisson distribution. The probabilities can be calculated using the probability mass function of Poisson distribution. This table may be used to make it easier to calculate probabilities using the Poisson distribution. You can refer to the values from the table and substitute it in the Poisson distribution formula to obtain the value of the probability.
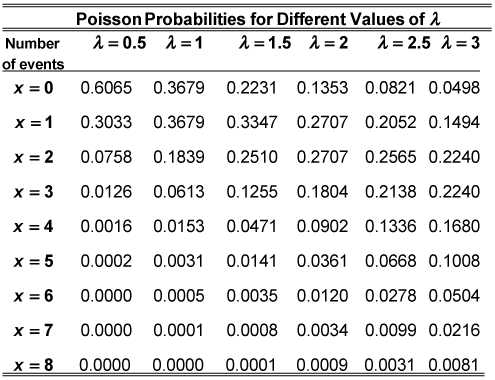
Table 1: Poisson probabilities for different values of λ.[4]
Poisson distribution mean and variance
As mentioned earlier, the Poisson distribution has only one parameter, λ. Therefore, the mean and variance of a Poisson distribution is λ. This can be expressed as follows:
E(X) = V(X) = λ
where
- E(X) is the expected mean of a Poisson distribution
- V(X) is the variance of a Poisson distribution
- λ > 0.

Key takeaways
Poisson distribution is a type of discrete probability distribution, expressing the probability of a given number of events occurring in a fixed interval of time. Its probability mass function can be calculated using the Poisson distribution formula or Poisson distribution table.
Researchers can leverage the Poisson distribution to model and analyze events or occurrences with a known average rate, aiding in understanding patterns, predicting future outcomes, and making informed decisions in various fields such as epidemiology, finance, telecommunications, and more. Understanding and using the Poisson distribution where applicable will allow researchers to make the most of the power of probability and statistics in both theoretical analyses and practical applications.
Frequently asked questions
- Why is Poisson distribution used?
The Poisson distribution can help model the occurrence of rare events in a fixed interval of time or space when the events happen independently and at a constant average rate.
2. When is Poisson distribution used?
The Poisson distribution is used in cases where individual events happen at random and independently and when the mean number of events occurring within a given interval of time or space is known.
3. What is the difference between Poisson distribution and binomial distribution?
The Poisson distribution and binomial distribution are both probability distributions used to model the number of events occurring within a certain context. However, they are applied in different scenarios and have distinct characteristics. In binomial distribution, the probability of repeated number of trials are studied. Binomial distribution is biparametric and has two outcomes. In contrast, Poisson distribution gives the count of independent events occurring randomly within a given period of time. It is uniparametric and has an unlimited number of outcomes.
4. What is lambda in Poisson distribution?
In the context of the Poisson distribution, lambda (λ) represents the average rate of event occurrences per unit of time or space. Both the mean and variance of the Poisson distribution are equal to λ.
5. What is Poisson distribution and its application?
Poisson distribution is a type of discrete probability distribution that is particularly useful in situations where the events of interest are random and infrequent, for example:
- Modeling the number of occurrences of traffic accidents, arrivals at a service facility, and phone calls at a call center.
- Calculating the probability of a certain number of events occurring within a specified time frame or space, given the average rate at which they typically occur.
- Forecasting future occurrences, e.g., predicting the number of claims that might be made in a given period.
- Monitoring defect rates and identifying deviations from expected levels of performance.
References:
- Probability mass functions, Hands-On Data Science and Python Machine Learning by Frank Kane, O’Reilly website. Accessed April 28, 2024, at https://www.oreilly.com/library/view/hands-on-data-science/9781787280748/c5bebb0b-be4f-476a-a975-d10e74500282.xhtml
- Poisson Distribution, Cuemath website. Accessed April 28, 2024, at https://www.cuemath.com/data/poisson-distribution/
- Poisson Distribution – Definition, Formula, Table and Examples. GeeksforGeeks.org. Accessed April 28, 2024, at https://www.geeksforgeeks.org/poisson-distribution/
- Anderson, A. How to Compute Poisson Probabilities. Business Statistics for Dummies. Accessed April 28, 2024, at https://www.dummies.com/article/business-careers-money/business/accounting/calculation-analysis/how-to-compute-poisson-probabilities-145941/
R Discovery is a literature search and research reading platform that accelerates your research discovery journey by keeping you updated on the latest, most relevant scholarly content. With 250M+ research articles sourced from trusted aggregators like CrossRef, Unpaywall, PubMed, PubMed Central, Open Alex and top publishing houses like Springer Nature, JAMA, IOP, Taylor & Francis, NEJM, BMJ, Karger, SAGE, Emerald Publishing and more, R Discovery puts a world of research at your fingertips.
Try R Discovery Prime FREE for 1 week or upgrade at just US$72 a year to access premium features that let you listen to research on the go, read in your language, collaborate with peers, auto sync with reference managers, and much more. Choose a simpler, smarter way to find and read research – Download the app and start your free 7-day trial today!

