
A variable is an important element of research. It is a characteristic, number, or quantity of any category that can be measured or counted and whose value may change with time or other parameters.
Variables are defined in different ways in different fields. For instance, in mathematics, a variable is an alphabetic character that expresses a numerical value. In algebra, a variable represents an unknown entity, mostly denoted by a, b, c, x, y, z, etc. In statistics, variables represent real-world conditions or factors. Despite the differences in definitions, in all fields, variables represent the entity that changes and help us understand how one factor may or may not influence another factor.
Variables in research and statistics are of different types—independent, dependent, quantitative (discrete or continuous), qualitative (nominal/categorical, ordinal), intervening, moderating, extraneous, confounding, control, and composite. In this article we compare the first two types—independent vs dependent variables.
What is a variable?
Researchers conduct experiments to understand the cause-and-effect relationships between various entities. In such experiments, the entities whose values change are called variables. These variables describe the relationships among various factors and help in drawing conclusions in experiments. They help in understanding how some factors influence others. Some examples of variables include age, gender, race, income, weight, etc.
As mentioned earlier, different types of variables are used in research. Of these, we will compare the most common types—independent vs dependent variables. The independent variable is the cause and the dependent variable is the effect, that is, independent variables influence dependent variables. In research, a dependent variable is the outcome of interest of the study and the independent variable is the factor that may influence the outcome. Let’s explain this with an independent and dependent variable example: In a study to analyze the effect of antibiotic use on microbial resistance, antibiotic use is the independent variable and microbial resistance is the dependent variable because antibiotic use affects microbial resistance.(1)
What is an independent variable?
Here is a list of the important characteristics of independent variables.(2,3)
- An independent variable is the factor that is being manipulated in an experiment.
- In a research study, independent variables affect or influence dependent variables and cause them to change.
- Independent variables help gather evidence and draw conclusions about the research subject.
- They’re also called predictors, factors, treatment variables, explanatory variables, and input variables.
- On graphs, independent variables are usually placed on the X-axis.
- Example: In a study on the relationship between screen time and sleep problems, screen time is the independent variable because it influences sleep (the dependent variable).
- In addition, some factors like age are independent variables because other variables such as a person’s income will not change their age.

Types of independent variables
Independent variables in research are of the following two types:(4)
Quantitative
Quantitative independent variables differ in amounts or scales. They are numeric and answer questions like “how many” or “how often.”
Here are a few examples of independent variables in quantitative research:
- Differences in treatment dosages and frequencies: Useful in determining the appropriate dosage to get the desired outcome.
- Varying salinities: Useful in determining the range of salinity that organisms can tolerate.
Qualitative
Qualitative independent variables are non-numerical variables.
A few examples of independent variables are listed below:
- Different strains of a species: Useful in identifying the strain of a crop that is most resistant to a specific disease.
- Varying methods of how a treatment is administered—oral or intravenous.
A quantitative variable is represented by actual amounts and a qualitative variable by categories or groups.

What is a dependent variable?
Here are a few characteristics of dependent variables: (3)
- A dependent variable represents a quantity whose value depends on the independent variable and how it is changed.
- The dependent variable is influenced by the independent variable under various circumstances.
- It is also known as the response variable and outcome variable.
- On graphs, dependent variables are placed on the Y-axis.
Here are a few dependent variable examples:
- In a study on the effect of exercise on mood, the dependent variable is mood because it may change with exercise.
- In a study on the effect of pH on enzyme activity, the enzyme activity is the dependent variable because it changes with changing pH.
Types of dependent variables
Dependent variables are of two types:(5)
Continuous dependent variables
These variables can take on any value within a given range and are measured on a continuous scale, for example, weight, height, temperature, time, distance, etc.
Categorical or discrete dependent variables
These variables are divided into distinct categories. They are not measured on a continuous scale so only a limited number of values are possible, for example, gender, race, etc.

Differences between independent and dependent variables
The following table compares independent vs dependent variables.
| Independent variable | Dependent variable | |
| How to identify | Manipulated or controlled | Observed or measured |
| Purpose | Cause or predictor variable | Outcome or response variable |
| Relationship | Independent of other variables | Influenced by the independent variable |
| Control | Manipulated or assigned by researcher | Measured or observed during experiments |
Independent and dependent variable examples
Listed below are a few examples of research questions from various disciplines and their corresponding independent and dependent variables.(6)
| Discipline | Research question | Independent variable | Dependent variable |
| Genetics | What is the relationship between genetics and susceptibility to diseases? | genetic factors | susceptibility to diseases |
| History | How do historical events influence national identity? | historical events | national identity |
| Political science | What is the effect of political campaign advertisements on voter behavior? | political campaign advertisements | voter behavior |
| Sociology | How does social media influence cultural awareness? | social media exposure | cultural awareness |
| Economics | What is the impact of economic policies on unemployment rates? | economic policies | unemployment rates |
| Literature | How does literary criticism affect book sales? | literary criticism | book sales |
| Geology | How do a region’s geological features influence the magnitude of earthquakes? | geological features | earthquake magnitudes |
| Environment | How do changes in climate affect wildlife migration patterns? | climate changes | wildlife migration patterns |
| Gender studies | What is the effect of gender bias in the workplace on job satisfaction? | gender bias | job satisfaction |
| Film studies | What is the relationship between cinematographic techniques and viewer engagement? | cinematographic techniques | viewer engagement |
| Archaeology | How does archaeological tourism affect local communities? | archaeological techniques | local community development |
Independent vs dependent variables in research
Experiments usually have at least two variables—independent and dependent. The independent variable is the entity that is being tested and the dependent variable is the result. Classifying independent and dependent variables as discrete and continuous can help in determining the type of analysis that is appropriate in any given research experiment, as shown in the table below. (7)
| Dependent variable | |||
| Discrete | Continuous | ||
| Independent variable | Discrete | Chi-Square | t-test |
| Logistic regression | ANOVA | ||
| Phi | Regression | ||
| Cramer’s V | Point-biserial correlation | ||
| Continuous | Logistic regression | Regression | |
| Point-biserial correlation | Correlation | ||
Here are some more research questions and their corresponding independent and dependent variables. (6)
| Research question | Independent variable | Dependent variable |
| What is the impact of online learning platforms on academic performance? | type of learning | academic performance |
| What is the association between exercise frequency and mental health? | exercise frequency | mental health |
| How does smartphone use affect productivity? | smartphone use | productivity levels |
| Does family structure influence adolescent behavior? | family structure | adolescent behavior |
| What is the impact of nonverbal communication on job interviews? | nonverbal communication | job interviews |
How to identify independent vs dependent variables
In addition to all the characteristics of independent and dependent variables listed previously, here are few simple steps to identify the variable types in a research question.(8)
- Keep in mind that there are no specific words that will always describe dependent and independent variables.
- If you’re given a paragraph, convert that into a question and identify specific words describing cause and effect.
- The word representing the cause is the independent variable and that describing the effect is the dependent variable.
Let’s try out these steps with an example.
A researcher wants to conduct a study to see if his new weight loss medication performs better than two bestseller alternatives. He wants to randomly select 20 subjects from Richmond, Virginia, aged 20 to 30 years and weighing above 60 pounds. Each subject will be randomly assigned to three treatment groups.
To identify the independent and dependent variables, we convert this paragraph into a question, as follows: Does the new medication perform better than the alternatives? Here, the medications are the independent variable and their performances or effect on the individuals are the dependent variable.

Visualizing independent vs dependent variables
Data visualization is the graphical representation of information by using charts, graphs, and maps. Visualizations help in making data more understandable by making it easier to compare elements, identify trends and relationships (among variables), among other functions.
Bar graphs, pie charts, and scatter plots are the best methods to graphically represent variables. While pie charts and bar graphs are suitable for depicting categorical data, scatter plots are appropriate for quantitative data. The independent variable is usually placed on the X-axis and the dependent variable on the Y-axis.
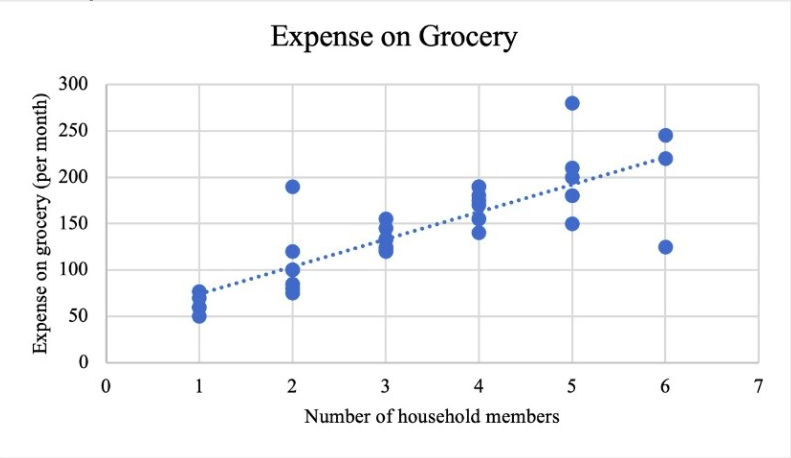
Figure 1 is a scatter plot that depicts the relationship between the number of household members and their monthly grocery expenses.9 The number of household members is the independent variable and the expenses the dependent variable. The graph shows that as the number of members increases the expenditure also increases.
Key takeaways
Let’s summarize the key takeaways about independent vs dependent variables from this article:
- A variable is any entity being measured in a study.
- A dependent variable is often the focus of a research study and is the response or outcome. It depends on or varies with changes in other variables.
- Independent variables cause changes in dependent variables and don’t depend on other variables.
- An independent variable can influence a dependent variable, but a dependent variable cannot influence an independent variable.
- An independent variable is the cause and dependent variable is the effect.
Practice Problems: Identify the Variables
Test your understanding with these worked examples. For each scenario, identify the independent variable (IV) and dependent variable (DV).
Worked Examples
| # | Scenario | Independent Variable | Dependent Variable |
|---|---|---|---|
| 1 | A researcher tests whether listening to music while studying affects exam scores | Type of study condition (music vs. silence) | Exam scores |
| 2 | Scientists measure how different amounts of fertilizer affect plant height | Amount of fertilizer applied | Plant height |
| 3 | A company runs an A/B test to see if a red or green CTA button gets more clicks | Button color | Click-through rate |
| 4 | Doctors examine whether daily aspirin use reduces the risk of heart attacks | Aspirin use (daily vs. none) | Incidence of heart attacks |
| 5 | A teacher studies whether class size influences student participation | Class size | Student participation rate |
Practice Problems (Try Before Checking the Answer)
Problem 1: A psychologist wants to know if the number of hours of sleep affects reaction time in adults.
- IV: Hours of sleep
- DV: Reaction time
Problem 2: A nutritionist studies whether a high-protein diet leads to greater weight loss than a standard diet over 12 weeks.
- IV: Type of diet (high-protein vs. standard)
- DV: Amount of weight lost
Problem 3: An HR manager investigates whether remote work increases employee productivity.
- IV: Work arrangement (remote vs. in-office)
- DV: Employee productivity (measured by output per hour)
Problem 4: A marketer tests three different subject lines in an email campaign to see which generates the most opens.
- IV: Email subject line variation
- DV: Email open rate
Problem 5: A biologist studies whether temperature affects the rate at which yeast ferments sugar.
- IV: Temperature
- DV: Rate of fermentation
Independent and Dependent Variables in Mathematics and Algebra
While these concepts are central to research, they also appear frequently in mathematics, particularly in algebra, functions, and graphing.
Definitions in a Math Context
- In algebra, the independent variable is the input value: the number you choose or substitute into an equation
- The dependent variable is the output value: the result you calculate after substituting the input
- The relationship between the two is expressed as a function, commonly written as y = f(x)
How Variables Appear on a Graph
- The independent variable (x) is always plotted on the horizontal axis (X-axis)
- The dependent variable (y) is always plotted on the vertical axis (Y-axis)
- This convention holds in both mathematics and scientific research, making axis labeling a reliable way to identify which variable is which
Math Examples
| Equation | Independent Variable | Dependent Variable | What it means |
|---|---|---|---|
| y = 2x + 5 | x | y | y changes based on whatever value x takes |
| y = x² | x | y | y is the square of x |
| Distance = Speed × Time | Time | Distance | Distance covered depends on how long you travel |
| Total Cost = Price × Quantity | Quantity | Total Cost | The more units bought, the higher the cost |
Key Difference from Research Variables
- In mathematics, neither variable is manipulated; the relationship is purely definitional and follows a fixed rule
- In experimental research, the independent variable is actively manipulated by the researcher to observe a real-world effect
- Both contexts share the same cause-and-effect logic, but research introduces uncertainty, measurement error, and the need for statistical analysis
Real-World and Business Examples
Independent and dependent variables are not limited to laboratory research. They appear in everyday business decisions, marketing strategy, economics, and workplace analysis.
Business and Marketing
| Business Scenario | Independent Variable | Dependent Variable |
|---|---|---|
| A/B testing a website homepage layout | Homepage design version | Conversion rate |
| Testing two pricing strategies for a subscription product | Price point | Number of new subscribers |
| Varying the posting time of social media content | Time of posting | Engagement rate (likes, shares) |
| Running ads on different platforms simultaneously | Advertising platform | Cost per lead |
| Offering a discount to one customer segment | Discount offered | Purchase frequency |
Human Resources and Organizational Research
- IV: Remote vs. hybrid vs. in-office work policy → DV: Employee satisfaction scores
- IV: Type of onboarding program → DV: Time to productivity for new hires
- IV: Manager feedback frequency → DV: Team retention rate
- IV: Training hours per quarter → DV: Performance review ratings
Economics and Policy
| Policy Scenario | Independent Variable | Dependent Variable |
|---|---|---|
| Effect of minimum wage increases | Minimum wage level | Employment rate among low-wage workers |
| Impact of interest rate changes | Central bank interest rate | Inflation rate |
| Influence of tax cuts on consumer spending | Tax rate | Consumer spending levels |
| Effect of trade tariffs on domestic production | Tariff rate | Volume of domestic manufacturing output |
Why Business Examples Matter
- In business, identifying variables correctly prevents misattribution: assuming a result was caused by one factor when another was responsible
- A/B tests, usability studies, and employee surveys all follow the same IV/DV logic as formal scientific experiments
- Clearly defining the IV and DV before running any business experiment ensures the findings are actionable and defensible to stakeholders
Frequently asked questions
-
What are the different types of variables used in research?
The following table lists the different types of variables used in research.(10)
| Variable type | Characteristic | Example |
| Categorical | Measures a construct that has different categories | gender, race, religious affiliation, political affiliation |
| Quantitative | Measures constructs that vary by degree of the amount | weight, height, age, intelligence scores |
| Independent (IV) | Measures constructs considered to be the cause | Higher education (IV) leads to higher income (DV) |
| Dependent (DV) | Measures constructs that are considered the effect | Exercise (IV) will reduce anxiety levels (DV) |
| Intervening or mediating (MV) | Measures constructs that intervene or stand in between the cause and effect | Incarcerated individuals are more likely to have psychiatric disorder (MV), which leads to disability in social roles |
| Confounding (CV) | “Rival explanations” that explain the cause-and-effect relationship | Age (CV) explains the relationship between increased shoe size and increase in intelligence in children |
| Control variable | Extraneous variables whose influence can be controlled or eliminated | Demographic data such as gender, socioeconomic status, age |
2. Why is it important to differentiate between independent vs dependent variables?
Differentiating between independent vs dependent variables is important to ensure the correct application in your own research and also the correct understanding of other studies. An incorrectly framed research question can lead to confusion and inaccurate results. An easy way to differentiate is to identify the cause and effect.
3. How are independent and dependent variables used in non-experimental research?
So far in this article we talked about variables in relation to experimental research, wherein variables are manipulated or measured to test a hypothesis, that is, to observe the effect on dependent variables. Let’s examine non-experimental research and how variable are used.11 In non-experimental research, variables are not manipulated but are observed in their natural state. Researchers do not have control over the variables and cannot manipulate them based on their research requirements. For example, a study examining the relationship between income and education level would not manipulate either variable. Instead, the researcher would observe and measure the levels of each variable in the sample population. The level of control researchers have is the major difference between experimental and non-experimental research. Another difference is the causal relationship between the variables. In non-experimental research, it is not possible to establish a causal relationship because other variables may be influencing the outcome.
4. Are there any advantages and disadvantages of using independent vs dependent variables?
Here are a few advantages and disadvantages of both independent and dependent variables.(12)
Advantages:
- Dependent variables are not liable to any form of bias because they cannot be manipulated by researchers or other external factors.
- Independent variables are easily obtainable and don’t require complex mathematical procedures to be observed, like dependent variables. This is because researchers can easily manipulate these variables or collect the data from respondents.
- Some independent variables are natural factors and cannot be manipulated. They are also easily obtainable because less time is required for data collection.
Disadvantages:
- Obtaining dependent variables is a very expensive and effort- and time-intensive process because these variables are obtained from longitudinal research by solving complex equations.
- Independent variables are prone to researcher and respondent bias because they can be manipulated, and this may affect the study results.
We hope this article has provided you with an insight into the use and importance of independent vs dependent variables, which can help you effectively use variables in your next research study.
References
- Kaliyadan F, Kulkarni V. Types of variables, descriptive statistics, and sample size. Indian Dermatol Online J. 2019 Jan-Feb; 10(1): 82–86. https://www.ncbi.nlm.nih.gov/pmc/articles/PMC6362742/
- What Is an independent variable? (with uses and examples). Indeed website. Accessed March 11, 2024. https://www.indeed.com/career-advice/career-development/what-is-independent-variable
- Independent and dependent variables: Differences & examples. Statistics by Jim website. Accessed March 10, 2024. https://statisticsbyjim.com/regression/independent-dependent-variables/
- Independent variable. Biology online website. Accessed March 9, 2024. https://www.biologyonline.com/dictionary/independent-variable#:~:text=The%20independent%20variable%20in%20research,how%20many%20or%20how%20often.
- Dependent variables: Definition and examples. Clubz Tutoring Services website. Accessed March 10, 2024. https://clubztutoring.com/ed-resources/math/dependent-variable-definitions-examples-6-7-2/
- Research topics with independent and dependent variables. Good research topics website. Accessed March 12, 2024. https://goodresearchtopics.com/research-topics-with-independent-and-dependent-variables/
- Levels of measurement and using the correct statistical test. Univariate quantitative methods. Accessed March 14, 2024. https://web.pdx.edu/~newsomj/uvclass/ho_levels.pdf
- Easiest way to identify dependent and independent variables. Afidated website. Accessed March 15, 2024. https://www.afidated.com/2014/07/how-to-identify-dependent-and.html
- Choosing data visualizations. Math for the people website. Accessed March 14, 2024. https://web.stevenson.edu/mbranson/m4tp/version1/environmental-racism-choosing-data-visualization.html
- Trivedi C. Types of variables in scientific research. Concepts Hacked website. Accessed March 15, 2024. https://conceptshacked.com/variables-in-scientific-research/
- Variables in experimental and non-experimental research. Statistics solutions website. Accessed March 14, 2024. https://www.statisticssolutions.com/variables-in-experimental-and-non-experimental-research/#:~:text=The%20independent%20variable%20would%20be,state%20instead%20of%20manipulating%20them.
- Dependent vs independent variables: 11 key differences. Formplus website. Accessed March 15, 2024. https://www.formpl.us/blog/dependent-independent-variables
Editage All Access is a subscription-based platform that unifies the best AI tools and services designed to speed up, simplify, and streamline every step of a researcher’s journey. The Editage All Access Pack is a one-of-a-kind subscription that unlocks full access to an AI writing assistant, literature recommender, journal finder, scientific illustration tool, and exclusive discounts on professional publication services from Editage.
Based on 22+ years of experience in academia, Editage All Access empowers researchers to put their best research forward and move closer to success. Explore our top AI Tools pack, AI Tools + Publication Services pack, or Build Your Own Plan. Find everything a researcher needs to succeed, all in one place – Get All Access now starting at just $14 a month!
This article was published on March 21, 2024, and updated on June 7, 2026.

